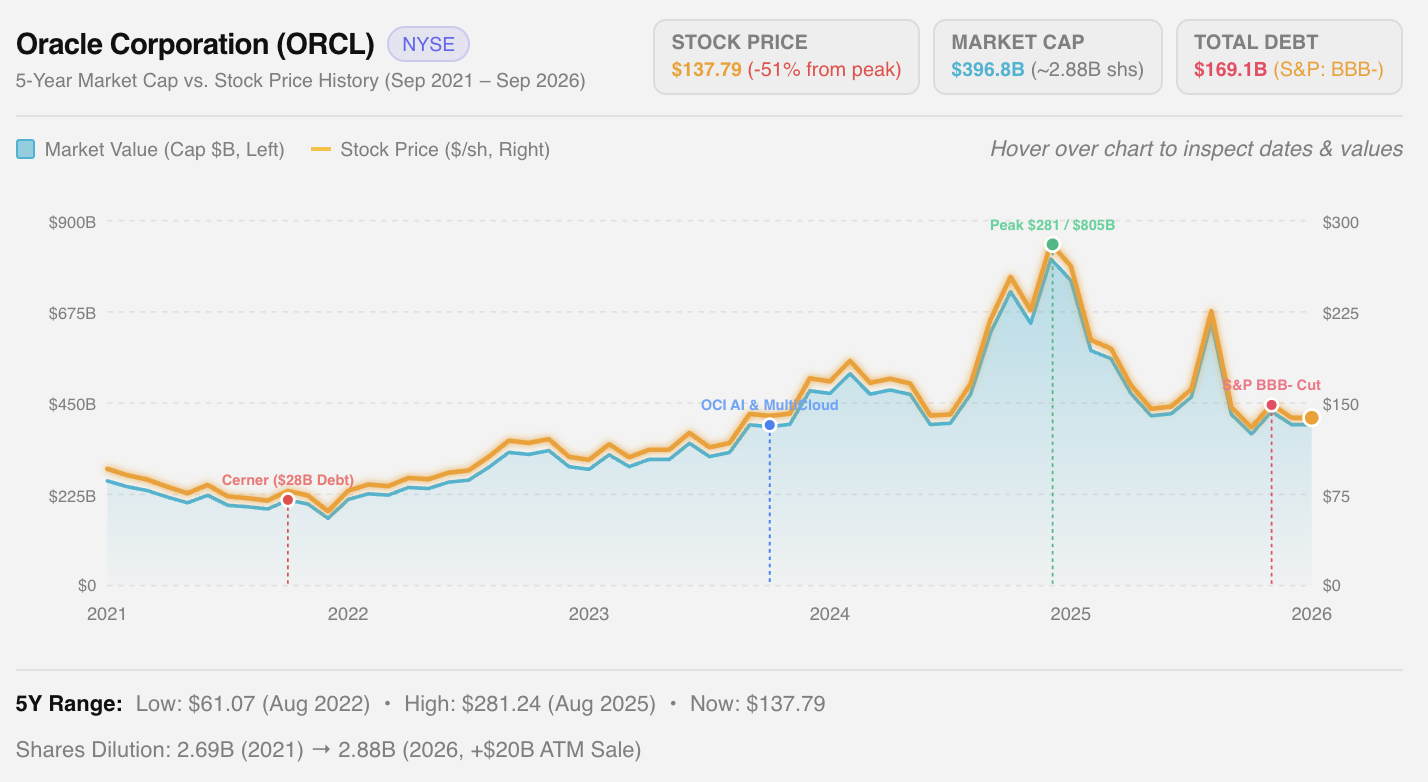
1. 5-Year Market Value & Stock Price Trajectory (2021–2026)
Over the past 5 years, Oracle has experienced one of the most volatile swings in mega-cap tech history—transitioning from a "legacy database" cash cow into a high-growth AI hyperscaler, before confronting severe balance sheet strain.
  $300 |                                                 /\ (Aug 2025: $281 close / $322 peak)
       |                                                /  \   Market Cap: ~$805B+
  $225 |                                               /    \
       |                                       _..---''      \      /\
  $150 |                              _..---''                \    /  \
       |                   _..---''                            \  /    \  Current: $137.79
   $75 |  ====---.._...--''                                     \/      \ Market Cap: $396.8B
       |_________________________________________________________________
Sep 2021 Sep 2022 Sep 2023 Sep 2024 Sep 2025 Sep 2026Key Historical Milestones:
1. 2021 – Mid 2022 (The Cerner Hangover):
- Oracle traded in the $65–$95 range. In June 2022, Oracle closed its $28.3 billion all-cash acquisition of Cerner, funding it by issuing massive bridge loans and long-term notes. The stock bottomed at $61.07 in August 2022.
2. 2023 – Early 2024 (The OCI & AI Pivot):
- Oracle Cloud Infrastructure (OCI) gained traction as the premier cost-effective cloud for GPU training (securing deals with Cohere, NVIDIA DGX Cloud, and xAI). The stock rallied from $87 to $125.
3. Mid 2024 – Late 2025 (The Multi-Cloud & OpenAI Frenzy):
- Oracle struck landmark multicloud partnerships (Oracle Database@Azure, Google Cloud, and AWS), followed by a massive AI infrastructure deal with OpenAI.
- Fueled by surging cloud backlogs, ORCL rallied to an all-time peak of $281.24 (closing) and $322.54 (intraday) in August 2025, briefly catapulting Oracle's market cap above $800 billion.
4. Late 2025 – 2026 (Reality Check & Balance Sheet Stress):
- CapEx exploded to fund a committed $250B global AI datacenter network. Free cash flow swung sharply negative (-$24B in FY2026).
- Total debt crossed $169B, triggering an S&P rating downgrade to BBB- in July 2026. Rumors of delays ("Project Jupiter" force majeure notices) and a $20B equity dilution (ATM offering) knocked the stock down over 50% to $137.79.
2. Is Now a Good Time to Buy ORCL?
The Bull Case (Why It Could Be a Compelling Buy at ~$138)
- Valuation Normalization: At its 2025 peak, Oracle traded at over 45x forward earnings. Following a 51% haircut, its forward P/E has compressed to roughly 19x–21x, inline with historical enterprise software multiples while delivering substantially higher top-line growth.
- Explosive OCI Growth: In Q1 FY2027, OCI revenue surged 121% YOY to $7.4B, while total cloud revenue jumped 62% to $11.6B. Oracle is taking meaningful enterprise cloud market share from incumbent hyperscalers.
- Astronomical Contracted Backlog: Remaining Performance Obligations (RPO) reached an unprecedented $664 Billion (up $209B YOY). Customers are legally committed to tens of billions in long-term compute and database consumption.
- Sticky Legacy Moat: Oracle's core relational database and ERP systems (NetSuite, Fusion) remain deeply embedded in Fortune 500 workflows, generating high gross margins (70%+) that continue to fund cloud expansion.
The Bear Case (Major Risks to Consider)
- Imminent "Fallen Angel" (Junk) Risk: S&P’s BBB- rating leaves Oracle exactly one downgrade away from speculative/junk status. If Oracle is downgraded to high-yield (BB+), institutional bondholders (pension funds, investment-grade ETFs) would be mandated to dump Oracle debt, spiking refinancing yields.
- Alarming Cash Burn: In Q1 FY2027 alone, Capex reached $28.5 billion. Free cash flow is deeply negative, meaning Oracle cannot self-fund its operations and infrastructure without continuous capital injections.
- Shareholder Dilution: To avoid a credit downgrade in 2026, Oracle tapped a $20 billion At-the-Market (ATM) stock offering, expanding the share count toward 2.88B+ shares. Continued negative FCF will likely result in further dilution.
- Execution & Energy Bottlenecks: Power grid delays and supply constraints (e.g., reports surrounding Project Jupiter in New Mexico) highlight the friction of deploying gigawatt-scale data centers.
Verdict & Investment Strategy:
| Investor Profile | Recommendation | Strategy |
|---|---|---|
| Conservative / Income | AVOID / HOLD | High risk of credit rating downgrade, dividend growth is frozen, and negative FCF prevents buybacks. |
| Growth / Tech Accumulator | SPECULATIVE BUY (DCA) | The 50%+ discount creates an asymmetrical risk/reward on AI infrastructure demand. Do not lump-sum; Dollar-Cost Average in 3–4 tranches around the $125–$138 support zone. |
3. How Bad Is Oracle's Debt? (A Deep Balance Sheet Audit)
Oracle’s debt situation is one of the most leveraged among mega-cap tech corporations, far exceeding the balance sheet leverage of peers like Microsoft, Alphabet, or Meta (which maintain net cash positions).
Balance Sheet Snapshot (Q1 FY2027 / Aug 2026)
| Metric | Current Level | Historical Context (FY2022) |
|---|---|---|
| Total Debt | $169.1 Billion | $84.0 Billion (+101%) |
| Cash & Equivalents | $36.4 Billion | $21.4 Billion |
| Net Debt | $132.7 Billion | $62.6 Billion (+112%) |
| Net Debt / EBITDA | ~4.2x – 4.5x | ~2.9x |
| Annual Interest Expense | ~$3.8B – $4.2B | ~$2.7B |
| Credit Rating (S&P) | BBB- (Stable) | BBB+ |
| Credit Rating (Moody's) | Baa2 (Negative Outlook) | Baa1 |
Why Did Oracle's Debt Get So High?
1. The 2022 Cerner Buyout: Oracle spent $28.3 billion in cash to acquire Cerner, funded predominantly through new debt issuances right as global interest rates began to surge. 2. Aggressive Historical Share Buybacks: Throughout 2018–2021, Oracle spent tens of billions repurchasing its own stock using borrowed money, leaving the company with negative common equity (accumulated deficit in book equity). 3. The $250B AI Infrastructure Arms Race: Unlike Microsoft and Google, which fund AI data centers out of massive $70B–$100B annual operating cash flows, Oracle’s operating cash flow (~$18B–$22B) was insufficient to cover its $28.5B quarterly capex ramp, forcing debt expansion.
Is Oracle at Risk of Bankruptcy?
- No, bankruptcy is NOT an immediate threat:
- Oracle sits on $36.4 billion in cash liquidity.
- Its core database and enterprise software maintenance agreements provide predictable, high-margin, contracted recurring revenue.
- In June 2026, Oracle stated it will pause incremental bond issuances for calendar year 2026 and use prepayments and joint ventures to fund buildouts.
- However, the financial flexibility is severely impaired:
- Oracle is walking a tightrope on the edge of "junk" bond status.
- Interest expense consumes roughly 20% of its operating profit.
- To protect its investment-grade rating, management has shifted the burden onto equity holders via share dilution ($20B ATM equity sale) and by eliminating share buybacks.
4. Key Metrics to Monitor in Coming Quarters
1. Free Cash Flow inflection: Does capex peak and decline back toward operating cash flow levels? 2. S&P / Moody's Rating Notices: Any shift to a negative outlook by S&P would signal imminent risk of high-yield downgrade. 3. OCI Backlog Conversion Rate: Conversion speed of the $664B RPO into recognized revenue. 4. Capex Moderation: Management's discipline in funding data centers through customer prepayments rather than balance sheet leverage.