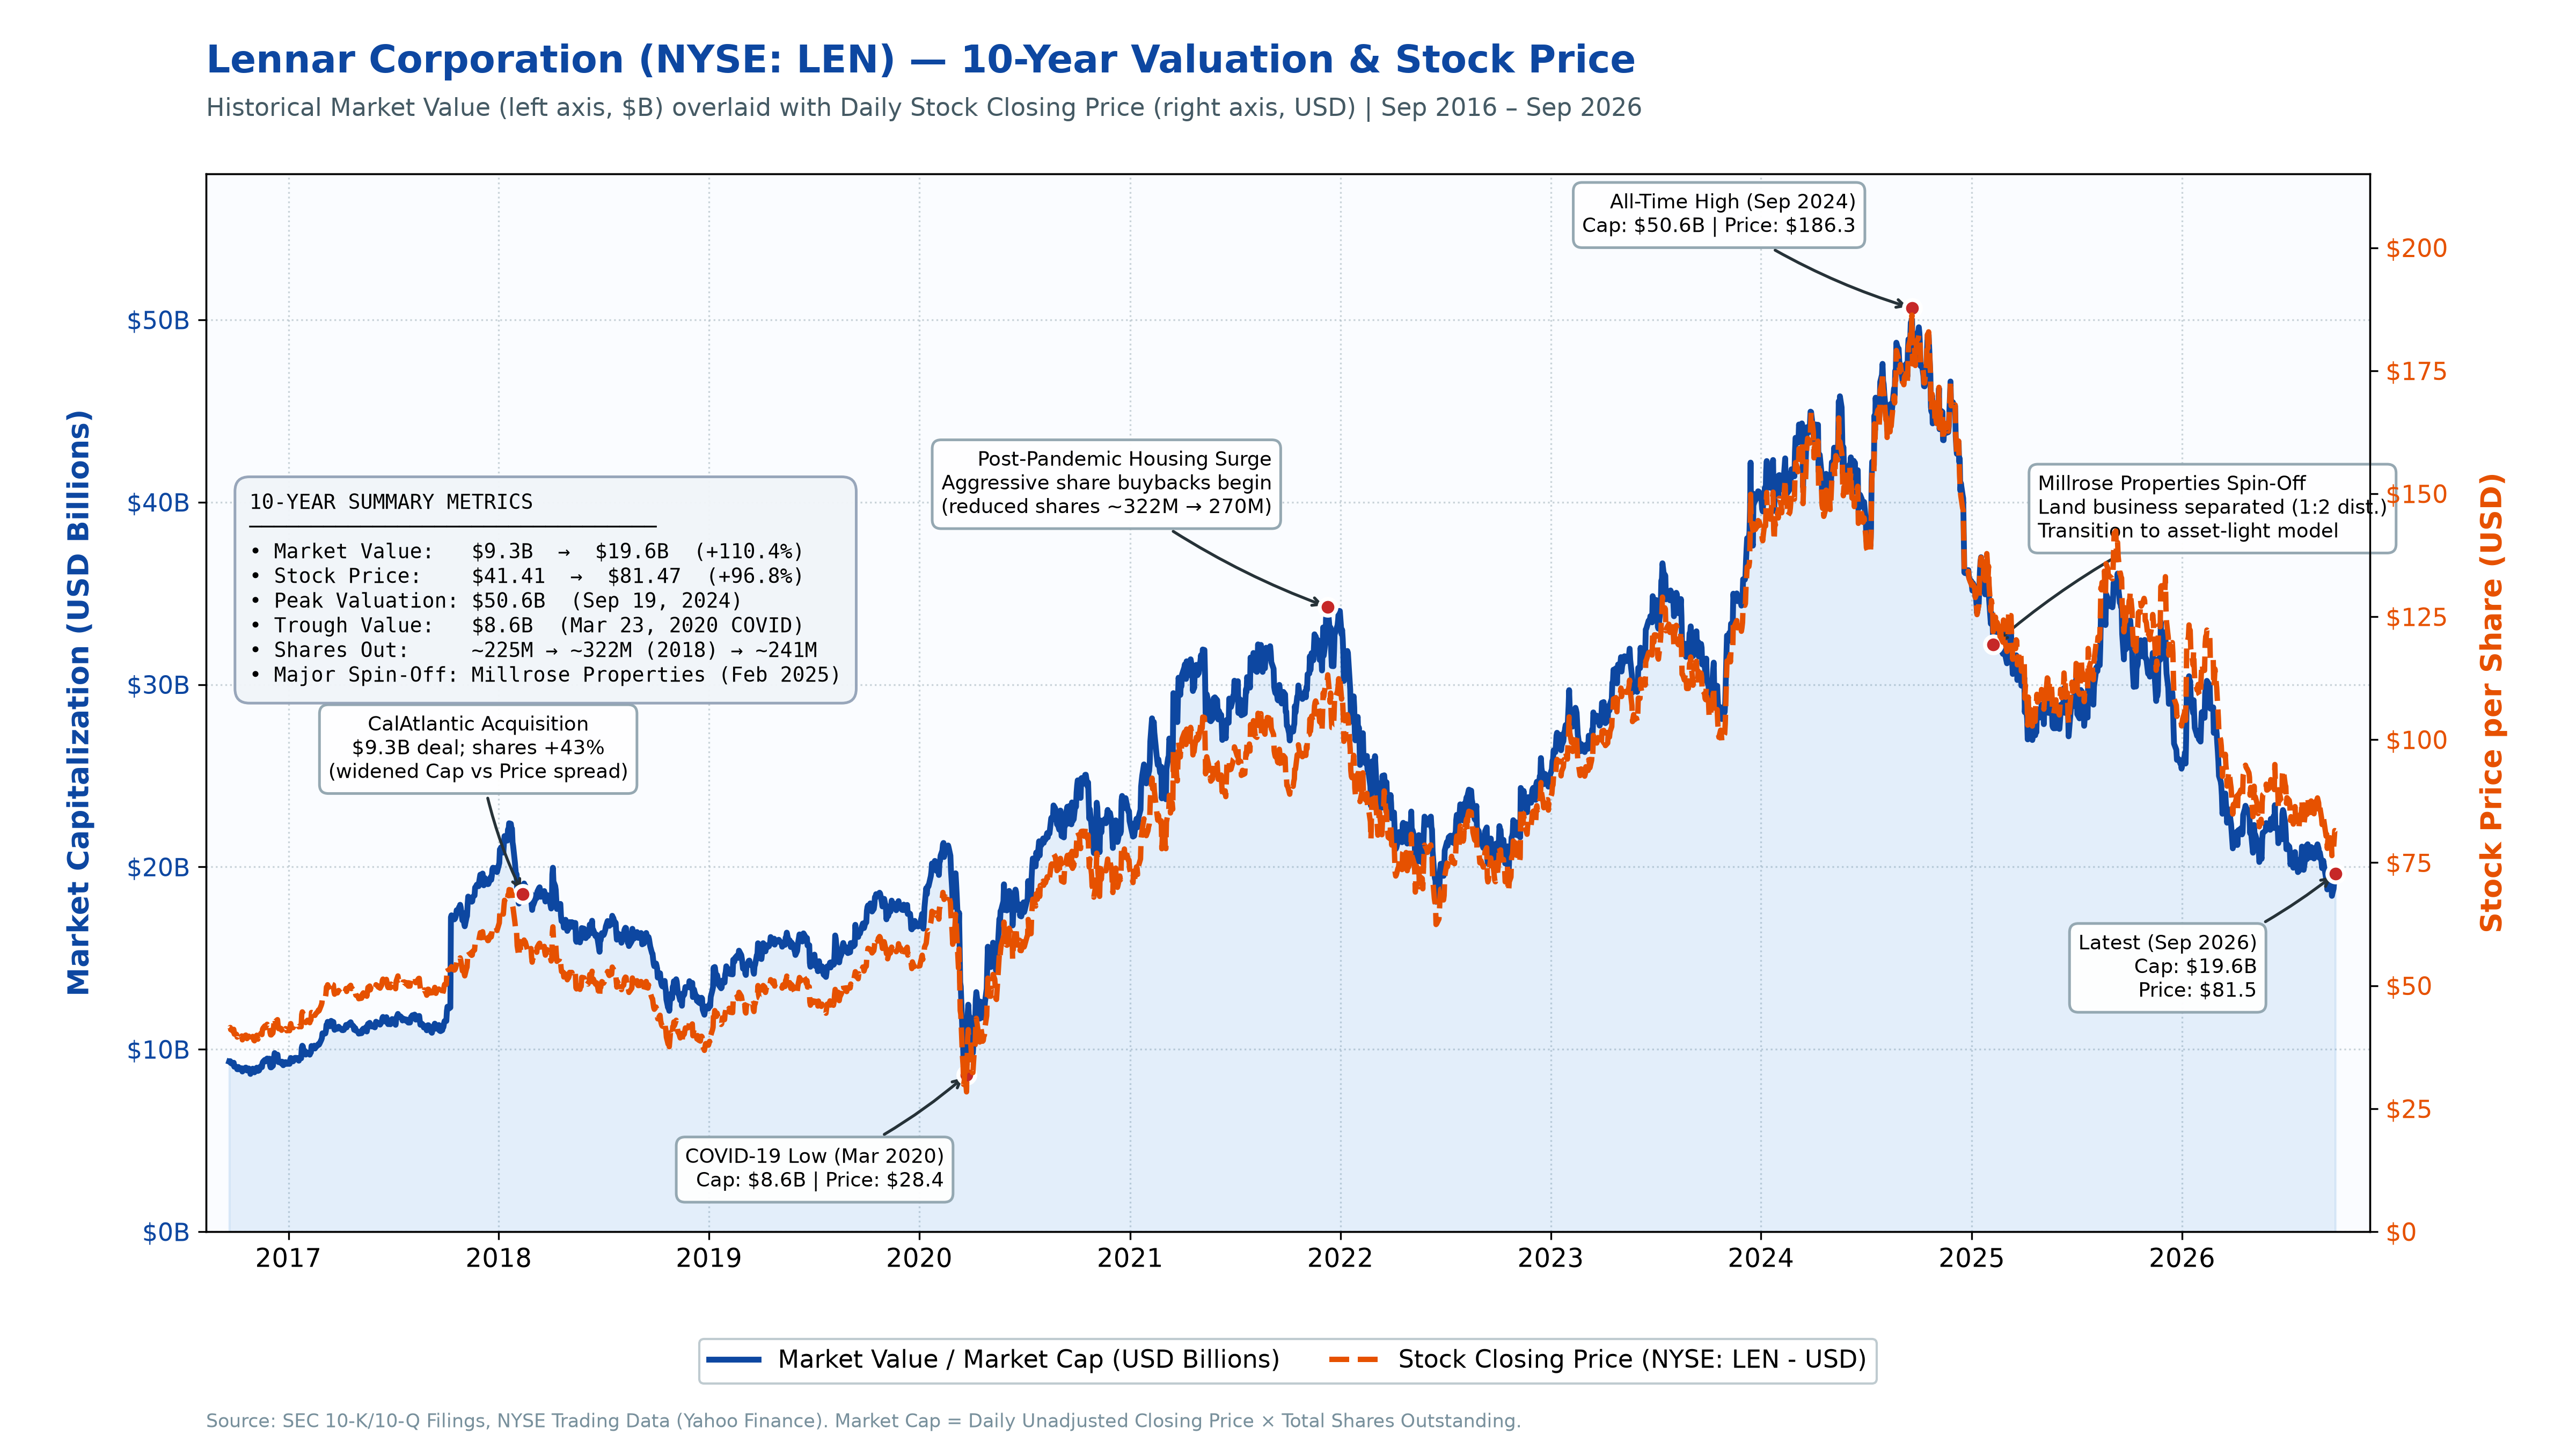
Milestone Summary Table
| Date | Event / Period | Market Cap (\$B) | Stock Price (\$) | Shares Out. | Key Context / Dynamics |
|---|---|---|---|---|---|
| Sep 20, 2016 | Baseline (10 Yrs Ago) | \$9.33B | \$41.41 | ~225.2M | Post-recession housing recovery phase |
| Feb 12, 2018 | CalAtlantic Acquisition | \$19.86B | \$61.64 | ~322.1M | \$9.3B stock/cash merger; shares expanded by +43% |
| Mar 23, 2020 | COVID-19 Market Trough | \$8.60B | \$28.41 | ~305.2M | Global pandemic liquidity sell-off across equities |
| Dec 10, 2021 | Post-Pandemic Housing Boom | \$34.33B | \$113.43 | ~302.6M | Record home demand, low rates; aggressive buybacks begin |
| Sep 19, 2024 | All-Time Peak Valuation | \$50.64B | \$186.30 | ~271.8M | Multi-year peak margins, strong backlog, reduced float |
| Feb 07, 2025 | Millrose Properties Spin-Off | \$32.25B | \$128.87 | ~250.2M | Land & lot development spun off (1:2 share distribution) |
| Sep 24, 2026 | Current Standing | \$19.63B | \$81.47 | ~240.9M | Standalone pure-play asset-light builder valuation |
Analysis: Market Cap vs. Stock Price Divergences
While stock price and market capitalization typically move in tandem, overlaying both metrics highlights three key phases where Lennar's capital structure altered per-share value:
A. The CalAtlantic Acquisition (2017–2018): Dilution vs. Enterprise Scale
In February 2018, Lennar acquired CalAtlantic Group in a \$9.3 billion transaction to create America’s largest homebuilder by revenue.
- The Divergence: The transaction issued tens of millions of new Lennar shares, expanding shares outstanding from ~225 million to over 322 million (+43%).
- Impact: Market capitalization jumped significantly faster than per-share stock price, widening the visual gap between the two curves on the chart.
B. The 2021–2024 Capital Return Cycle: Accretive Share Repurchases
Following the pandemic demand surge, Lennar generated substantial free cash flows and executed an aggressive share repurchase program.
- The Divergence: Total shares outstanding were systematically reduced from ~322 million down to ~271 million by late 2024.
- Impact: Per-share earnings and stock price grew faster than total company market value, enabling the stock to reach an all-time high of \$186.30 in September 2024.
C. The Millrose Properties (NYSE: MRP) Spin-Off (February 2025): Asset-Light Transition
On February 7, 2025, Lennar completed the tax-free spin-off of its real estate and land development operations into an independent public REIT, Millrose Properties, Inc. (NYSE: MRP):
- Distribution: Lennar shareholders received 1 share of Millrose for every 2 shares of Lennar held.
- Structural Re-rating: Lennar distributed roughly 80% of Millrose equity to shareholders, intentionally stripping billions of dollars worth of physical land assets off Lennar's balance sheet to transition into a pure-play, asset-light homebuilder.
- Valuation Reset: Standalone Lennar's market value adjusted to reflect the separate trading entity of Millrose, followed by a secondary exchange offer in late 2025 that retired additional Lennar shares.
Key Performance Indicators
- 10-Year Market Capitalization Growth:
+110.4%(\$9.33B → \$19.63B) - 10-Year Stock Price Appreciation:
+96.8%(\$41.41 → \$81.47) - Trough-to-Peak Expansion:
+488.8%(from \$8.60B in March 2020 to \$50.64B in September 2024) - Net Share Count Movement: Decreased from peak 322.7M (2018) to 240.9M (2026) due to sustained share retirement programs.