Executive Comparison Matrix
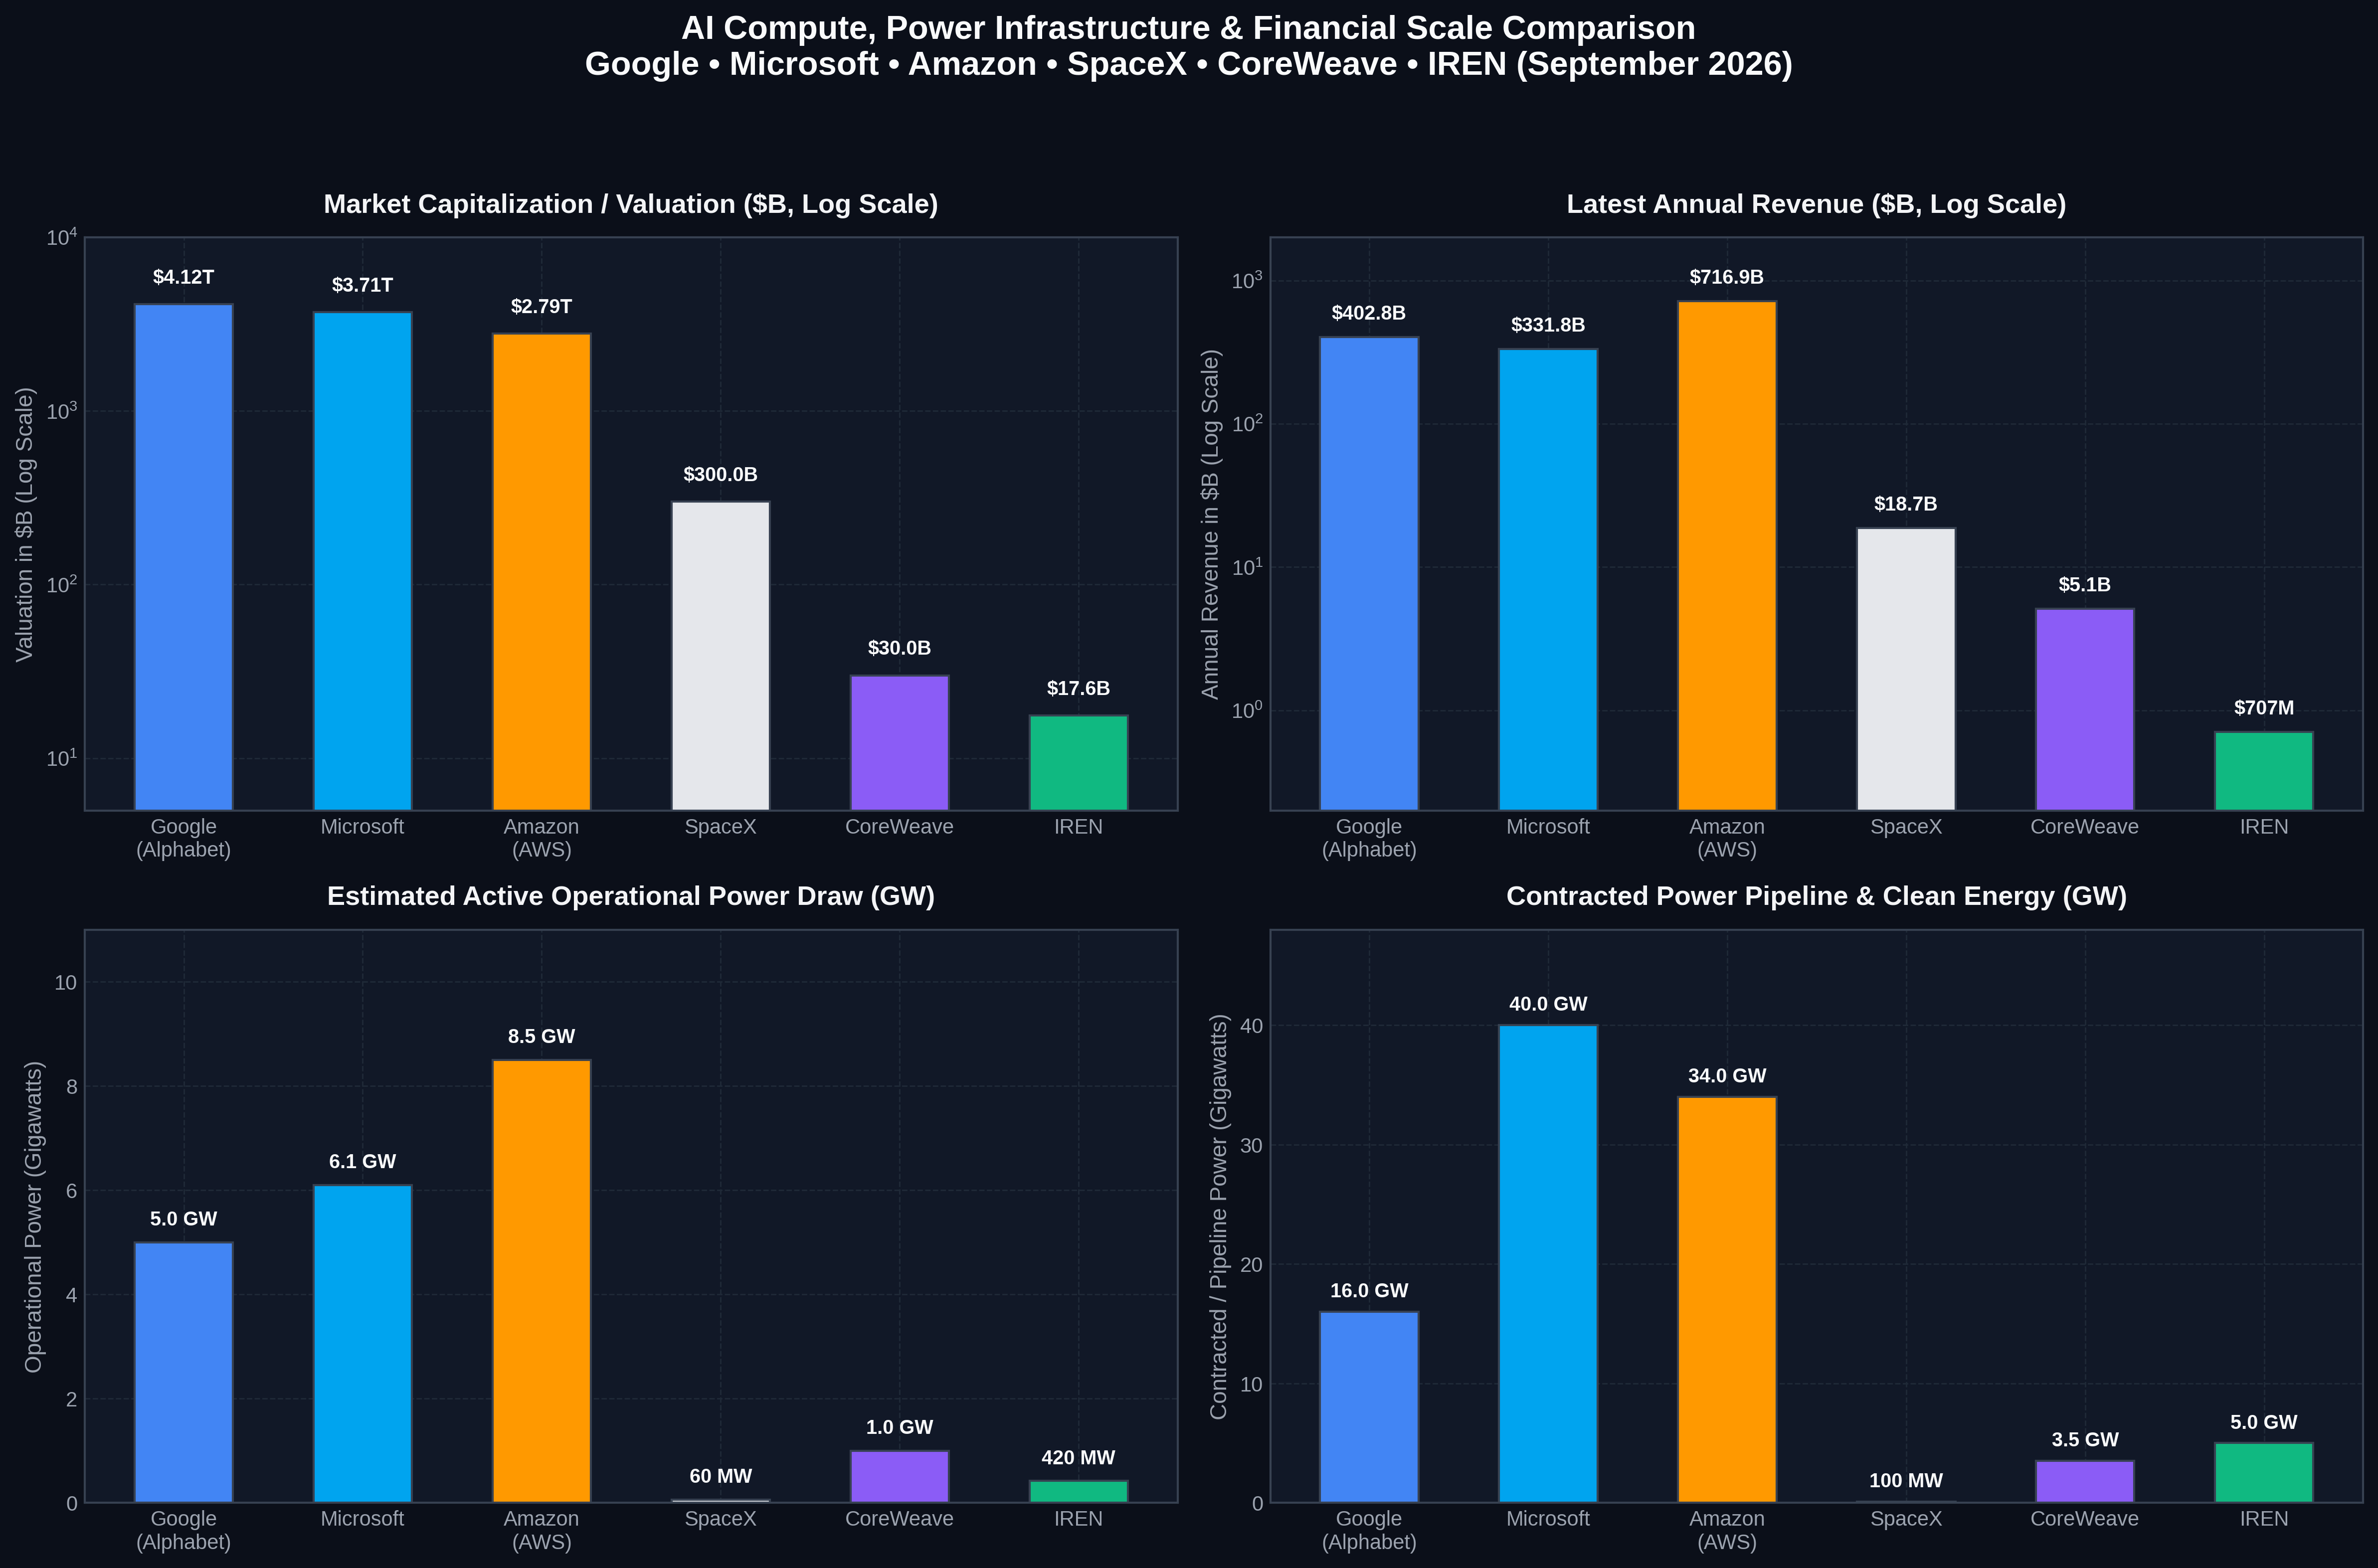
The table below summarizes Alphabet (Google), Microsoft, Amazon, IREN (Iris Energy), CoreWeave, and SpaceX across operational infrastructure and financial valuation metrics (market data as of September 4, 2026):
| Company | Latest FY Revenue | TTM / Run-Rate Revenue | Compute Architecture & Scale | Active Power Usage | Contracted Power & Pipeline | Market Value / Market Cap | Trailing P/E | Forward P/E (or Multiple) |
|---|---|---|---|---|---|---|---|---|
| Alphabet (Google) | $402.8B (FY25) | ~$445.8B (Cloud: ~$77.7B TTM; $99B run-rate) | Custom TPUs (v5p, v5e, Trillium v6, Ironwood) + NVIDIA GB200 NVL72; multi-exaflop Jupiter fabric | ~4.5 – 5.5 GW (~53–56 TWh/yr) | >16 GW clean energy PPAs; 500 MW Kairos SMR nuclear; Fervo geothermal | $4.12 Trillion | 17.00x | ~16.7x |
| Microsoft | $331.8B (FY26) | $331.8B (Azure: >$100B run-rate) | Custom Azure Maia (100 & 200) + tens of thousands of NVIDIA H100/H200/GB200 NVL72 nodes; Fairwater & Stargate campuses | ~5.5 – 6.8 GW (~42–46 TWh/yr) | >40 GW clean portfolio; 835 MW Constellation nuclear (Three Mile Island); 50 MW Helion fusion | $3.71 Trillion | 27.85x | ~25.6x – 25.9x |
| Amazon (AWS) | $716.9B (FY25) | ~$775.7B (AWS: $148.4B TTM; $169B run-rate) | Custom Trainium2 & Inferentia2 (Project Rainier: ~500k chips) + NVIDIA GB200/B200 (Project Ceiba: 414 exaflops) | ~7.0 – 10.0+ GW (~65–75 TWh/yr) | >34 GW clean PPAs; 960 MW Talen Susquehanna nuclear campus; 1.5+ GW SMR pipeline | $2.79 Trillion | 20.79x | ~28.0x – 32.0x |
| IREN (Iris Energy) | $707.0M (FY26) | $707.0M (AI Cloud: $128.8M FY26, Q4 run-rate $282M) | ~4,300 NVIDIA H100/H200/B200/B300 GPUs deployed/ordered + 23.2 EH/s Bitcoin mining ASICs transitioning to HPC | ~420 MW (~380 MW mining/transition + ~40 MW AI Cloud) | ~5.0 GW secured grid interconnections (Sweetwater 2.0 GW, Childress 750 MW, BC 180 MW) | $17.61 Billion | N/A (Net loss due to ASIC impairment) | ~18.0x – 24.0x (FY27 projected) |
| CoreWeave | $5.1B (FY25) | $8.0B – $9.5B+ (2026 guidance; $99.4B backlog) | Specialized neo-cloud: >250,000 NVIDIA enterprise GPUs (H100/H200/B200) on non-blocking Quantum-2/X800 InfiniBand | >1.0 GW (1,000+ MW) | 3.1 – 4.0+ GW pipeline (Core Scientific 590 MW, Chirisa microgrids, Lincoln Rackhouse) | ~$25B – $35B+ (IPO priced at $23B) | N/A (Capital intensive) | ~3.0x – 4.5x (EV/Forward Sales) |
| SpaceX | $18.7B (FY25) | $22.0B – $25.0B+ (Starlink: $17B–$20B projected) | Orbital edge compute: 6,500+ LEO satellites with hardened Linux/FPGA nodes, 9,000+ optical laser links (ISLs); FCC filings for orbital data centers | ~45 – 95 MW terrestrial + orbital solar (~15–25 MW on-orbit generation) | Multi-megawatt grid + private on-site natural gas & Tesla Megapack generation at Starbase | $250B – $350B+ (Private tender valuation) | N/A (Private entity) | ~13.4x – 18.7x (Implied P/S) |
Detailed Operational Breakdown
1. Alphabet (Google)
- Revenue: Consolidated FY2025 revenue reached $402.8 billion (+15.1% YOY), with net income of $132.2 billion (Alphabet Q4 & FY2025 Earnings). In Q2 2026, Google Cloud revenue expanded 82% YOY to$24.8 billion, achieving an annualized run rate of nearly $100 billion with a backlog of $514 billion (Alphabet Q2 2026 Earnings Release).
- Compute Power: Operates the custom Tensor Processing Unit (TPU) portfolio, including TPU v5p (up to 8,960-chip pods reaching 4.1 exaflops BF16 interconnected by Optical Circuit Switching), Trillium (TPU v6) offering a 4.7x compute gain per chip, and next-generation Ironwood (TPU v6/v7 tier). Commercial offerings feature A4X VMs powered by liquid-cooled NVIDIA GB200 NVL72 racks (Google Cloud A4X VMs).
- Power Usage & Grid Interaction: Consumed ~53–56 TWh in 2025, operating an active global data center load of 4.5 GW to 5.5 GW (Google 2026 Environmental Report). Google manages over 1 GW of automated demand response capacity with utility partners to adjust non-critical compute workloads during periods of grid strain (Google Demand Response Milestone).
- Contracted Power Pipeline: Over 16 GW in contracted clean power purchase agreements (PPAs). In October 2024, Google signed a master development agreement with Kairos Power for 500 MW of small modular reactor (SMR) capacity across 6–7 reactors delivering by 2030–2035 (Google Kairos Power Agreement), complemented by commercial enhanced geothermal power from Fervo Energy in Nevada.
2. Microsoft
- Revenue: Microsoft’s fiscal year 2026 (ended June 30, 2026) delivered $331.84 billion in revenue (+18% YOY) and $133.75 billion in GAAP net income (Microsoft FY26 Q4 & Full-Year Earnings). Azure crossed the$100 billion annual revenue run-rate milestone, while total Microsoft Cloud revenue surpassed $215 billion.
- Compute Power: Combines proprietary silicon—Azure Maia 100 (105B transistors) and Maia 200 (3nm, delivering >10 PFLOPS FP4, 216 GB HBM3e) (Maia 100 to 200 Architecture)—with liquid-cooled NVIDIA H100, H200, and GB200 clusters across its Fairwater campus series (such as Fairwater Atlanta at 636 MW and Fairwater Wisconsin scaling up to 3.3 GW) (Brightlio AI Data Centers), supporting OpenAI's infrastructure roadmap.
- Power Usage: Annual operational electricity consumption is estimated at 42–46 TWh, with active global continuous load running between 5.5 GW and 6.8 GW (Microsoft Sustainability Efficiency).
- Contracted Power Pipeline: Operates the world’s largest corporate clean energy portfolio with over 40 GW contracted. This is anchored by a 20-year PPA with Constellation Energy to restore the 835 MW Unit 1 reactor at Three Mile Island (renamed the Crane Clean Energy Center) starting in 2028 (Constellation Energy Release), a 50 MW commercial fusion PPA with Helion Energy, and a 10.5 GW renewable framework with Brookfield Renewable Partners (Brookfield & Microsoft Agreement).
3. Amazon (AWS)
- Revenue: Consolidated FY2025 revenue reached $716.9 billion (+12.4% YOY), with AWS delivering $128.7 billion (+20% YOY) (Digital Commerce 360's Amazon Analysis). In Q2 2026, AWS revenue grew 37% YOY to $42.2 billion ($169 billion run rate), with its custom silicon and AI business each exceeding a $25 billion annualized run rate (Amazon Q2 2026 Financial Results).
- Compute Power: Custom silicon is centered around Trainium2 (Trn2 instances) and Inferentia2 (Inf2 instances). AWS deployed Project Rainier, an AI cluster featuring approximately 500,000 Trainium2 chips built with Anthropic (About Amazon: Project Rainier). On the commercial side, AWS and NVIDIA deployed Project Ceiba, linking 20,736 GB200 Superchips to generate ~414 exaflops of AI compute (NVIDIA Newsroom: AWS Partnership).
- Power Usage: Active critical IT data center draw is estimated between 7.0 GW and 10.0+ GW, consuming 65–75+ TWh annually across global infrastructure (Review Energy Data Center Demand Study).
- Contracted Power Pipeline: Over 34 GW across >500 solar and wind projects. Nuclear initiatives include the acquisition of the Cumulus data center campus at Talen Energy's Susquehanna nuclear plant (up to 960 MW total capacity, with the initial 300 MW active while additional off-grid/co-location frameworks are evaluated) (Utility Dive Talen Coverage), as well as SMR agreements with Energy Northwest (320 MW scalable to 960 MW), X-energy, and Dominion Energy (Utility Dive SMR Deals).
4. IREN (Iris Energy)
- Revenue: Total FY2026 revenue reached $707.0 million (+41.1% YOY) (IREN Reports FY26 Results). AI Cloud Services revenue surged 685% YOY to $128.8 million. In Q4 FY26, AI Cloud revenue ($70.5M) surpassed Bitcoin mining revenue ($66.7M) for the first time. The company recorded a $638.8M non-cash impairment from retiring legacy ASICs to repurpose power halls for AI workloads (TradingView IREN FY26 Summary).
- Compute Power: Transitioning 23.2 EH/s of Bitcoin mining (~380 MW) into high-density AI hosting. Its deployed fleet comprises ~4,300 NVIDIA GPUs (Hopper H100/H200 and Blackwell B200/B300). In May 2026, IREN secured a $3.4 billion, 5-year AI Cloud hosting agreement with NVIDIA covering 60 MW of air-cooled data halls at Childress and Sweetwater 1 (Crypto News IREN NVIDIA Deal), alongside a $1.6 billion equipment agreement with Dell Technologies. In August 2026, IREN completed the acquisition of Kubernetes platform Mirantis to build a native cloud software layer.
- Power Usage: Currently energizing ~420 MW of active, utility-scale power drawing approximately 3.3 to 3.5 TWh annually from 100% renewable sources (hydro in British Columbia; wind/solar in West Texas).
- Contracted Power Pipeline: Controls approximately 5.0 GW (5,000 MW) of secured, interconnected grid capacity, headlined by Sweetwater 1 & 2 (2,000 MW in Nolan County, TX), Childress (750 MW in Texas), and British Columbia (180 MW).
5. CoreWeave
- Revenue: Revenue grew ~168% YOY to $5.1 billion in FY2025 (CoreWeave FY2025 Results), driven by anchor customers including Microsoft, Inflection AI, Mistral, and Meta (Sacra CoreWeave Analysis). In Q1 2026, revenue reached $2.1 billion (contracted backlog reaching $99.4 billion), with FY2026 revenue guided to $8.0B – $9.5B+ (TIKR Financial Research CoreWeave Report).
- Compute Power: Operates a dedicated fleet exceeding 250,000+ NVIDIA GPUs (H100, H200, and HGX B200/B300 systems) (CoreWeave GPU Compute). All nodes are interconnected via non-blocking, rail-optimized NVIDIA Quantum-2 (400 Gbps) and Quantum-X800 InfiniBand fabrics with GPUDirect RDMA (CoreWeave Blackwell Fleet Expansion).
- Power Usage: Surpassed 1.0 GW (1,000 MW) of active operational power across its global data center footprint in early 2026, scaling from 300 MW in 2024 (CoreWeave Q1 2026 Results).
- Contracted Power Pipeline: Holds 3.1 GW to 4.0+ GW of contracted data center power. Key partnerships include 590 MW across six facilities with Core Scientific (including a $1.2B expansion in Denton, TX) (Core Scientific Press Release), joint ventures with Chirisa Technology Parks utilizing Bloom Energy fuel-cell microgrids (Data Center Frontier Microgrid Coverage), and multi-hundred-megawatt leases with Lincoln Rackhouse.
6. SpaceX
- Revenue: Consolidated FY2025 revenue reached $18.7 billion (+43% YOY) (Sacra SpaceX Financials), with Starlink delivering $11.4B (61% of total revenue) and $4.4 billion in segment operating profit (SpaceDaily Starlink Analysis). In 2026, run-rate revenue is pacing toward $22.0B – $25.0B+, led by Starlink subscriber growth surpassing 10 million (Tiger Trade Revenue Breakdown).
- Compute Architecture: Operates edge and space-borne compute across 6,500+ active LEO satellites equipped with multi-core ARM/FPGA processing units (eoPortal Starlink Constellation Guide). Over 9,000 active optical inter-satellite laser links (ISLs) form an orbital mesh network routing terabits of data per second across vacuum without ground station intermediate hops (arXiv Optical Constellation Study). SpaceX has filed with the FCC for experimental constellations to explore orbital data center clusters (DebugLies Orbital AI Analysis).
- Power Usage & Pipeline: Terrestrial operations (Starbase in Boca Chica, TX; engine testing in McGregor; Florida launch complexes) draw 20 MW to 50+ MW, spiking during propellant liquefaction and Starship cryo-recycling. Orbital generation provides ~15 MW to 25 MW of continuous solar power. Terrestrially, SpaceX has deployed private natural gas generation and Tesla Megapack storage installations to mitigate utility grid bottlenecks (Financial Post SpaceX Energy Report).
Stock & Valuation Analysis
1. Alphabet Inc. (GOOGL)
- Market Capitalization: $4.12 Trillion (Share price: $338.46)
- P/E Ratios: 17.00x Trailing P/E (TTM EPS: $19.90); ~16.7x Forward P/E.
- Valuation Perspective: Alphabet trades at the lowest multiple among the mega-cap hyperscalers despite Google Cloud’s recent 82% YOY acceleration and substantial internal cost efficiencies from proprietary TPU silicon. The valuation provides an attractive margin of safety, though market participants monitor substantial CapEx expansion ($175B–$205B guided for 2026).
2. Microsoft Corporation (MSFT)
- Market Capitalization: $3.71 Trillion (Share price: $499.70)
- P/E Ratios: 27.85x Trailing P/E (FY26 EPS: $17.95); ~25.6x – 25.9x Forward P/E.
- Valuation Perspective: Microsoft commands a valuation premium reflecting enterprise software lock-in, commercial Copilot seat adoption (>30M paid seats), and a commercial RPO of $678 billion (+84% YOY). Sustaining this premium depends on converting massive infrastructure investments (Fairwater and Stargate) into durable enterprise operating margins.
3. Amazon.com, Inc. (AMZN)
- Market Capitalization: $2.79 Trillion (Share price: $258.51)
- P/E Ratios: 20.79x Trailing P/E (TTM EPS: $12.43); ~28.0x – 32.0x Normalized Forward P/E.
- Valuation Perspective: AWS’s re-acceleration to 37% YOY growth and triple-digit expansion in custom Trainium/Inferentia silicon ($25B+ run rate) provides operating leverage. Amazon's overall retail efficiency and logistics optimization help self-fund large-scale capital investments into gigawatt-scale power and data centers.
4. IREN Limited (IREN)
- Market Capitalization: $17.61 Billion (Share price: $44.68)
- P/E Ratios: Negative Trailing P/E (-$2.22 EPS due to a non-cash $638.8M ASIC impairment); ~18.0x – 24.0x Forward P/E based on FY27 projected AI Cloud revenues.
- Valuation Perspective: Enterprise Value of ~$18.2 billion. While trailing sales multiple appears elevated (~25.7x on FY26 revenue), the company’s valuation is primarily supported by its 5.0 GW of secured, interconnected grid capacity and its $3.4 billion NVIDIA contract. As power interconnection queues across the US stretch to 5–7 years, pre-interconnected energization commands a significant real-asset premium.
5. CoreWeave (CRWV)
- Market Capitalization: ~$25 Billion – $35+ Billion (Priced at $23B / $30B EV at 2025 IPO).
- Valuation Perspective: Trades at approximately 3.0x to 4.5x forward 2026 revenues ($8.0B–$9.5B guided). Although revenue growth is substantial (>100% YOY), CoreWeave relies heavily on debt-backed GPU financing ($7B+ in asset-backed credit facilities) and faces significant annual depreciation and interest expenses.
6. SpaceX (Private)
- Valuation: $250 Billion – $350+ Billion across 2024–2025 secondary tender transactions (Caproasia SpaceX Valuation Tracking).
- Valuation Perspective: Implies a Price-to-Sales multiple of ~13.4x to 18.7x against FY25 revenues ($18.7B). Starlink operates as a high-margin global connectivity utility (generating $4.4B in operating profit in 2025), which subsidizes Starship capital development.
Which Has the Best Growth Ahead?
The definition of "best growth" differs depending on whether you measure raw percentage expansion, durable compounding at scale, or unique technological moats:
Growth Profile Segmentation:
├── 1. Highest Raw Percentage Growth: CoreWeave & IREN
│   ├── CoreWeave: FY24 $1.9B → FY25 $5.1B → FY26E $9B+ (Backed by $99.4B contract backlog)
│   └── IREN: 685% YoY AI Cloud growth; unlocking 5 GW of scarce grid-interconnected power
│
├── 2. Most Durable Free-Cash-Flow Growth at Scale: Alphabet (Google)
│   ├── Lowest valuation multiple (17.0x P/E) among mega-caps
│   ├── Proprietary TPU custom silicon mitigates margin dilution from external GPU costs
│   └── Google Cloud accelerating at 82% YoY with $514B backlog
│
└── 3. Unmatched Monopolistic Growth Runway: SpaceX
    ├── Starlink expanding rapidly toward a projected $20B+ annual utility model
    └── Uncontested launch cadence (capturing ~80–90% of global orbital payload mass)
1. Best Absolute Percentage / Revenue Growth: CoreWeave & IREN
- CoreWeave presents the fastest near-term top-line revenue expansion, having grown from $1.9B in 2024 to $5.1B in 2025, with guidance of $8.0B–$9.5B+ in 2026 and a contracted backlog of $99.4 billion.
- IREN offers the highest leveraged growth opportunity on energy infrastructure. Having decommissioned legacy ASICs to pivot directly into enterprise AI hosting backed by its $3.4B NVIDIA deal, its 5 GW of pre-secured grid interconnection addresses the primary bottleneck in hyperscale compute today.
2. Best Risk-Adjusted & Durable Compounding Growth: Alphabet (Google)
- Trading at 17.00x P/E, Alphabet is the most favorably valued mega-cap relative to its underlying fundamentals.
- Google’s internal vertical integration through its TPU portfolio (v5e/v5p, Trillium v6, and Ironwood) cushions it against external hardware margin pressure. With Google Cloud growing at 82% YOY in Q2 2026 and a $514 billion backlog, Alphabet combines defensive cash generation from core digital advertising with rapid, high-margin cloud acceleration.
3. Best Long-Term Structural Moat: SpaceX
- SpaceX maintains an effective operational monopoly on Western orbital launch capacity, launching the majority of the world's commercial payload mass.
- Starlink is transitioning into a global broadband utility ($11.4B revenue in 2025; tracking $17B–$20B in 2026) that generates high operating cash flow (+$4.4B operating profit in 2025) while scaling toward direct-to-cellular connectivity and orbital data center infrastructure.